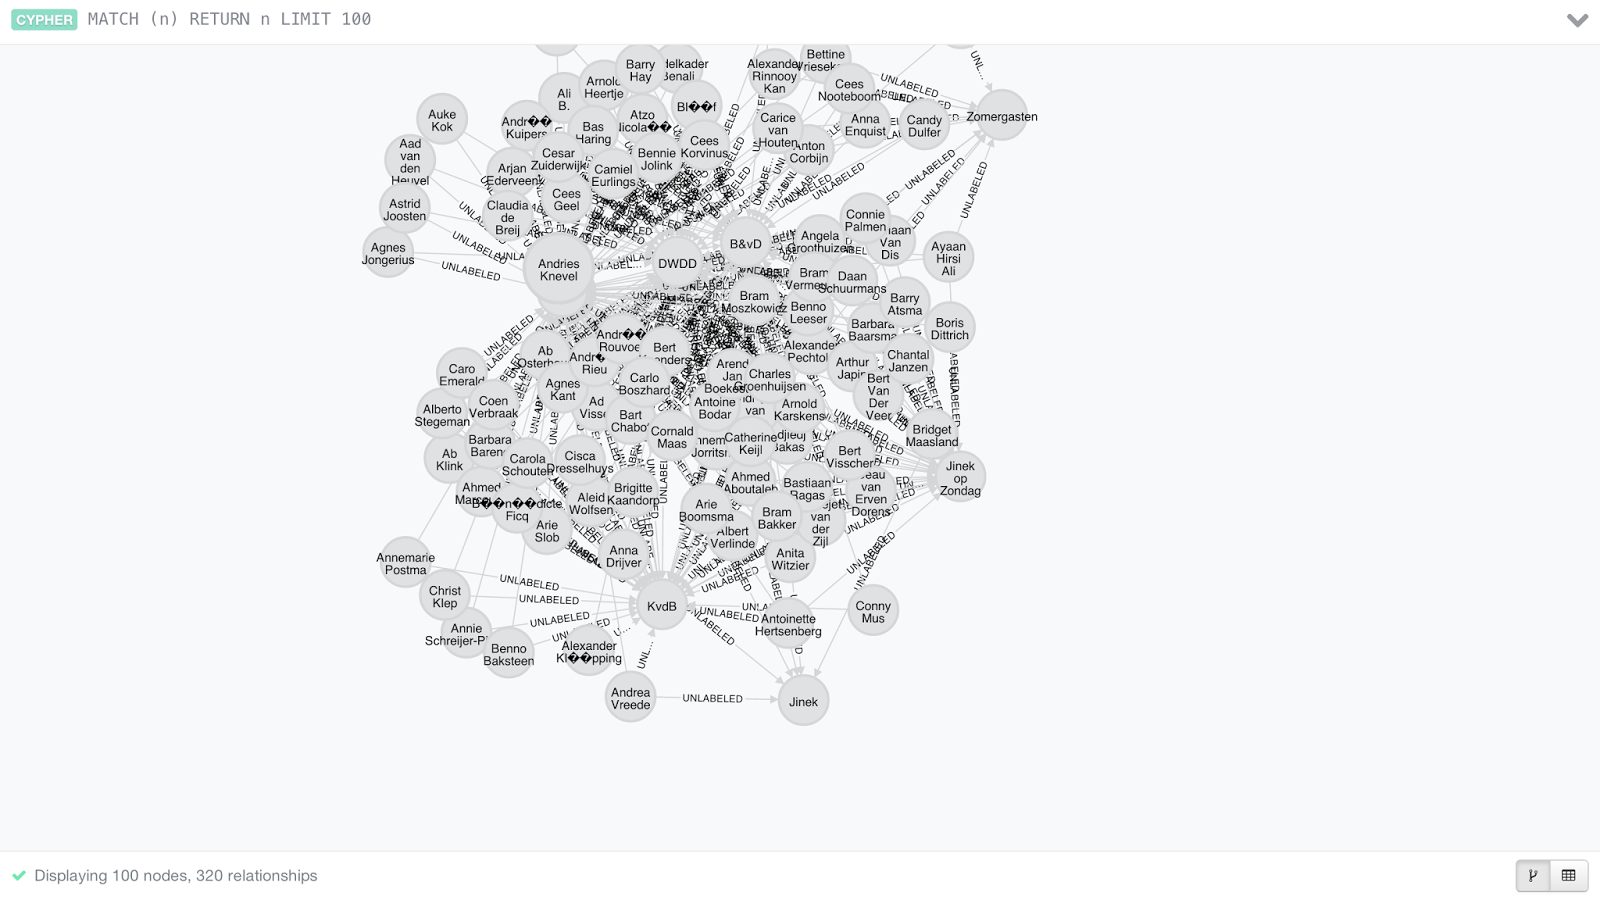
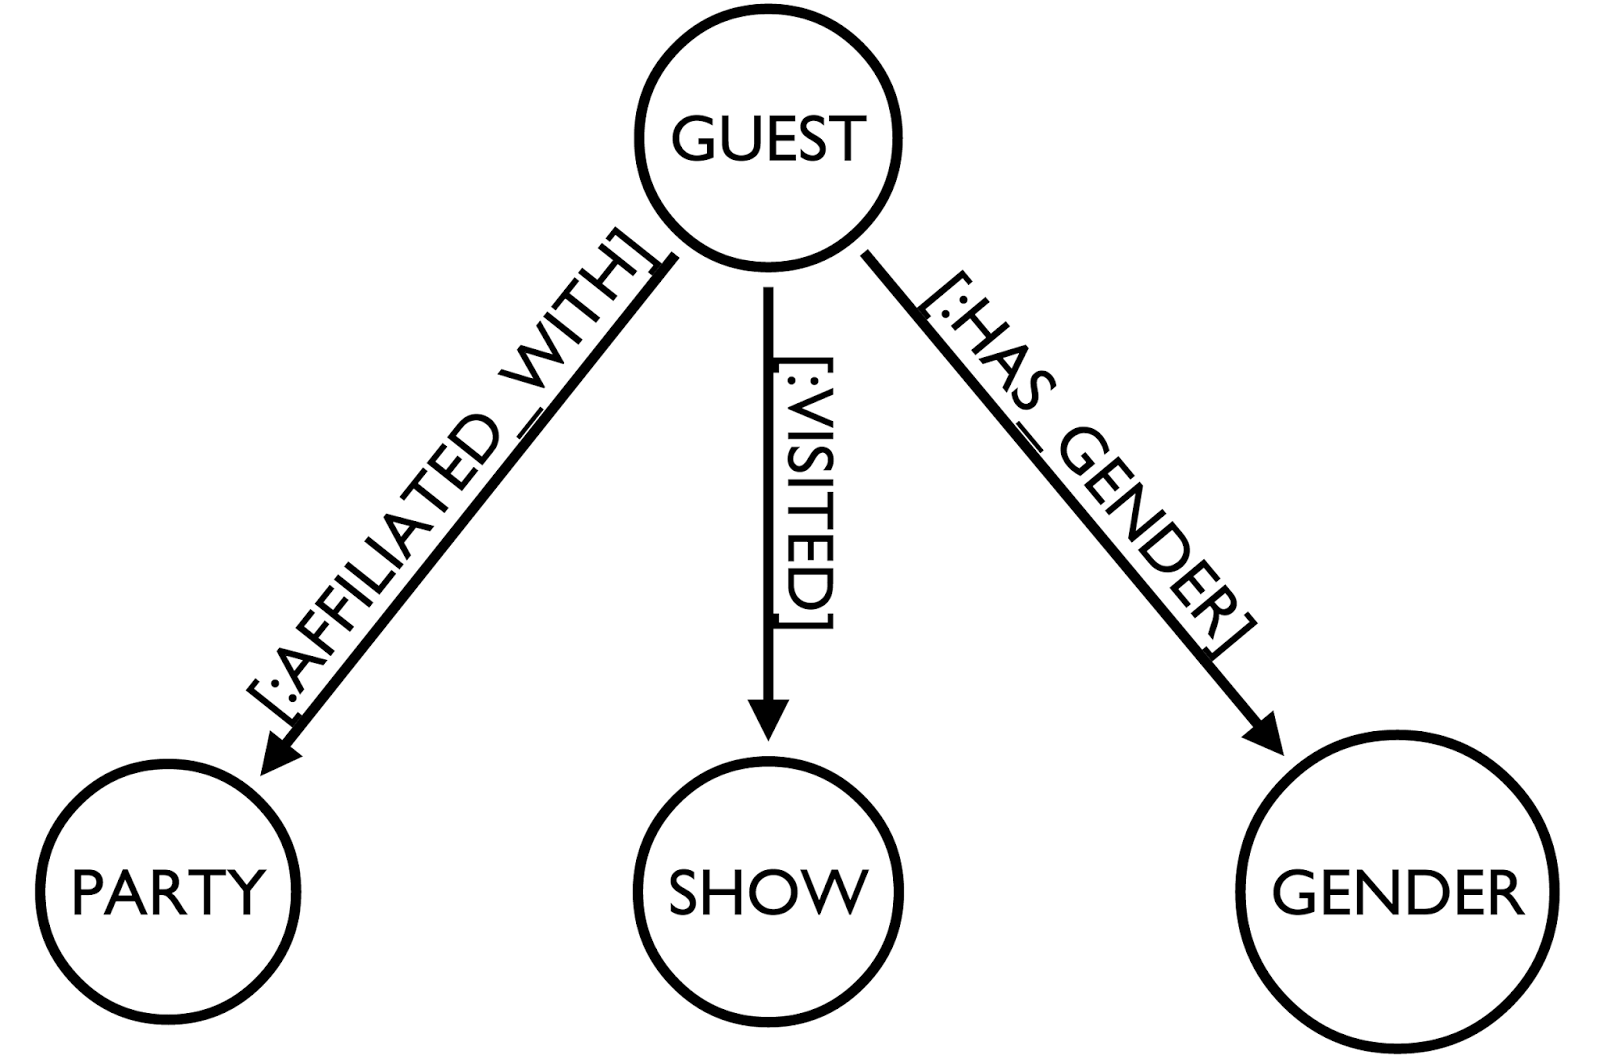
create (_0:`SHOW` {`Modularity Name`:"B&vD", `id`:"B&vD", `label`:"B&vD", `modularity_class`:3, `weighted outdegree`:0.000000})
create (_1:`SHOW` {`Modularity Name`:"P&W", `id`:"P&W", `label`:"P&W", `modularity_class`:4, `weighted outdegree`:0.000000})
create (_2:`SHOW` {`Modularity Name`:"DWDD", `id`:"DWDD", `label`:"DWDD", `modularity_class`:5, `weighted outdegree`:0.000000})
create (_3:`SHOW` {`Modularity Name`:"Zomergasten", `id`:"Zomergasten", `label`:"Zomergasten", `modularity_class`:0, `weighted outdegree`:0.000000})
create (_5:`SHOW` {`Modularity Name`:"KvdB", `id`:"KvdB", `label`:"KvdB", `modularity_class`:1, `weighted outdegree`:0.000000})
create (_11:`SHOW` {`Modularity Name`:"Jinek", `id`:"Jinek op Zondag", `label`:"Jinek op Zondag", `modularity_class`:2, `weighted outdegree`:0.000000})
create (_16:`SHOW` {`Modularity Name`:"Jinek", `id`:"Jinek", `label`:"Jinek", `modularity_class`:2, `weighted outdegree`:0.000000})
create (_35:`GUEST` {`Modularity Name`:"Jinek", `id`:"Annejet van der Zijl", `label`:"Annejet van der Zijl", `modularity_class`:2, `weighted outdegree`:4.000000})
create (_42:`GUEST` {`Modularity Name`:"KvdB", `Partij`:"VVD", `id`:"Arend Jan Boekestijn", `label`:"Arend Jan Boekestijn", `modularity_class`:1, `weighted outdegree`:12.000000})
create (_48:`GUEST` {`Modularity Name`:"P&W", `id`:"Arthur Japin", `label`:"Arthur Japin", `modularity_class`:4, `weighted outdegree`:5.000000})
create (_55:`GUEST` {`Modularity Name`:"DWDD", `id`:"Barry Atsma", `label`:"Barry Atsma", `modularity_class`:5, `weighted outdegree`:6.000000})
create (_57:`GUEST` {`Modularity Name`:"P&W", `id`:"Bart Chabot", `label`:"Bart Chabot", `modularity_class`:4, `weighted outdegree`:72.000000})
create (_84:`GUEST` {`Modularity Name`:"B&vD", `id`:"Cees Geel", `label`:"Cees Geel", `modularity_class`:3, `weighted outdegree`:5.000000})
create (_106:`GUEST` {`Modularity Name`:"DWDD", `id`:"Derk Sauer", `label`:"Derk Sauer", `modularity_class`:5, `weighted outdegree`:19.000000})
create (_119:`GUEST` {`Modularity Name`:"KvdB", `Partij`:"CDA", `id`:"Dries van Agt", `label`:"Dries van Agt", `modularity_class`:1, `weighted outdegree`:12.000000})
create (_128:`GUEST` {`Modularity Name`:"B&vD", `id`:"Ellen Ten Damme", `label`:"Ellen Ten Damme", `modularity_class`:3, `weighted outdegree`:8.000000})
create (_137:`GUEST` {`Modularity Name`:"KvdB", `id`:"Ernst Dani��l Smid", `label`:"Ernst Dani��l Smid", `modularity_class`:1, `weighted outdegree`:6.000000})
create (_170:`GUEST` {`Modularity Name`:"DWDD", `Partij`:"PVV", `id`:"Geert Wilders", `label`:"Geert Wilders", `modularity_class`:5, `weighted outdegree`:13.000000})
create (_180:`GUEST` {`Modularity Name`:"DWDD", `id`:"Giel Beelen", `label`:"Giel Beelen", `modularity_class`:5, `weighted outdegree`:155.000000})
create (_190:`GUEST` {`Modularity Name`:"DWDD", `id`:"Hadewych Minis", `label`:"Hadewych Minis", `modularity_class`:5, `weighted outdegree`:7.000000})
create (_192:`GUEST` {`Modularity Name`:"P&W", `Partij`:"VVD", `id`:"Halbe Zijlstra", `label`:"Halbe Zijlstra", `modularity_class`:4, `weighted outdegree`:14.000000})
create (_210:`GUEST` {`Modularity Name`:"P&W", `Partij`:"SP", `id`:"Harry van Bommel", `label`:"Harry van Bommel", `modularity_class`:4, `weighted outdegree`:18.000000})
create (_243:`GUEST` {`Modularity Name`:"P&W", `Partij`:"GL", `id`:"Ineke van Gent", `label`:"Ineke van Gent", `modularity_class`:4, `weighted outdegree`:6.000000})
create (_245:`GUEST` {`Modularity Name`:"P&W", `id`:"Ingeborg Beugel", `label`:"Ingeborg Beugel", `modularity_class`:4, `weighted outdegree`:13.000000})
create (_252:`GUEST` {`Modularity Name`:"KvdB", `id`:"Jaap Jongbloed", `label`:"Jaap Jongbloed", `modularity_class`:1, `weighted outdegree`:8.000000})
create (_279:`GUEST` {`Modularity Name`:"B&vD", `id`:"Jenny Arean", `label`:"Jenny Arean", `modularity_class`:3, `weighted outdegree`:6.000000})
create (_291:`GUEST` {`Modularity Name`:"P&W", `Partij`:"PVDA", `id`:"Job Cohen", `label`:"Job Cohen", `modularity_class`:4, `weighted outdegree`:53.000000})
create (_302:`GUEST` {`Modularity Name`:"P&W", `Partij`:"GL", `id`:"Jolande Sap", `label`:"Jolande Sap", `modularity_class`:4, `weighted outdegree`:23.000000})
create (_330:`GUEST` {`Modularity Name`:"Jinek", `id`:"Lange Frans", `label`:"Lange Frans", `modularity_class`:2, `weighted outdegree`:4.000000})
create (_380:`GUEST` {`Modularity Name`:"P&W", `Partij`:"VVD", `id`:"Melanie Schultz-Maas van Haegen Geesteranus", `label`:"Melanie Schultz-Maas van Haegen Geesteranus", `modularity_class`:4, `weighted outdegree`:7.000000})
create (_423:`GUEST` {`Modularity Name`:"P&W", `id`:"Peter Paul de Vries", `label`:"Peter Paul de Vries", `modularity_class`:4, `weighted outdegree`:33.000000})
create (_429:`GUEST` {`Modularity Name`:"P&W", `id`:"Peter Verhaar", `label`:"Peter Verhaar", `modularity_class`:4, `weighted outdegree`:24.000000})
create (_445:`GUEST` {`Modularity Name`:"DWDD", `id`:"Ramsey Nasr", `label`:"Ramsey Nasr", `modularity_class`:5, `weighted outdegree`:10.000000})
create (_448:`GUEST` {`Modularity Name`:"B&vD", `id`:"Ren�� Froger", `label`:"Ren�� Froger", `modularity_class`:3, `weighted outdegree`:8.000000})
create (_509:`GUEST` {`Modularity Name`:"KvdB", `id`:"Thomas Dekker", `label`:"Thomas Dekker", `modularity_class`:1, `weighted outdegree`:4.000000})
create (_552:`PARTY` {`name`:"CDA"})
create (_553:`PARTY` {`name`:"SP"})
create (_554:`PARTY` {`name`:"PVDA"})
create (_555:`PARTY` {`name`:"D66"})
create (_556:`PARTY` {`name`:"CU"})
create (_557:`PARTY` {`name`:"VVD"})
create (_558:`PARTY` {`name`:"PVV"})
create (_559:`PARTY` {`name`:"GL"})
create (_560:`PARTY` {`name`:"50PLUS"})
create (_561:`PARTY` {`name`:"?"})
create (_562:`PARTY` {`name`:"SGP"})
create (_563:`PARTY` {`name`:"EenNL"})
create (_564:`PARTY` {`name`:"PVDD"})
create (_565:`PARTY` {`name`:"LPF"})
create (_566:`PARTY` {`name`:"TROTS"})
create (_567:`GENDER` {`name`:"Male"})
create (_568:`GENDER` {`name`:"Female"})
create _35-[:`HAS_GENDER`]->_568
create _35-[:`VISITED` {`quantity`:1}]->_11
create _35-[:`VISITED` {`quantity`:1}]->_5
create _35-[:`VISITED` {`quantity`:1}]->_1
create _35-[:`VISITED` {`quantity`:1}]->_0
create _42-[:`AFFILIATED_WITH`]->_557
create _42-[:`HAS_GENDER`]->_567
create _42-[:`VISITED` {`quantity`:1}]->_11
create _42-[:`VISITED` {`quantity`:4}]->_5
create _42-[:`VISITED` {`quantity`:3}]->_2
create _42-[:`VISITED` {`quantity`:2}]->_1
create _42-[:`VISITED` {`quantity`:2}]->_0
create _48-[:`HAS_GENDER`]->_567
create _48-[:`VISITED` {`quantity`:1}]->_11
create _48-[:`VISITED` {`quantity`:1}]->_2
create _48-[:`VISITED` {`quantity`:3}]->_1
create _55-[:`HAS_GENDER`]->_567
create _55-[:`VISITED` {`quantity`:1}]->_11
create _55-[:`VISITED` {`quantity`:4}]->_2
create _55-[:`VISITED` {`quantity`:1}]->_1
create _57-[:`HAS_GENDER`]->_567
create _57-[:`VISITED` {`quantity`:2}]->_5
create _57-[:`VISITED` {`quantity`:8}]->_2
create _57-[:`VISITED` {`quantity`:41}]->_1
create _57-[:`VISITED` {`quantity`:21}]->_0
create _84-[:`HAS_GENDER`]->_567
create _84-[:`VISITED` {`quantity`:2}]->_2
create _84-[:`VISITED` {`quantity`:1}]->_1
create _84-[:`VISITED` {`quantity`:2}]->_0
create _106-[:`HAS_GENDER`]->_567
create _106-[:`VISITED` {`quantity`:1}]->_16
create _106-[:`VISITED` {`quantity`:1}]->_11
create _106-[:`VISITED` {`quantity`:7}]->_2
create _106-[:`VISITED` {`quantity`:4}]->_1
create _106-[:`VISITED` {`quantity`:6}]->_0
create _119-[:`AFFILIATED_WITH`]->_552
create _119-[:`HAS_GENDER`]->_567
create _119-[:`VISITED` {`quantity`:1}]->_11
create _119-[:`VISITED` {`quantity`:4}]->_5
create _119-[:`VISITED` {`quantity`:1}]->_3
create _119-[:`VISITED` {`quantity`:2}]->_2
create _119-[:`VISITED` {`quantity`:4}]->_1
create _128-[:`HAS_GENDER`]->_568
create _128-[:`VISITED` {`quantity`:2}]->_11
create _128-[:`VISITED` {`quantity`:1}]->_5
create _128-[:`VISITED` {`quantity`:1}]->_1
create _128-[:`VISITED` {`quantity`:4}]->_0
create _137-[:`HAS_GENDER`]->_567
create _137-[:`VISITED` {`quantity`:2}]->_5
create _137-[:`VISITED` {`quantity`:3}]->_2
create _137-[:`VISITED` {`quantity`:1}]->_1
create _170-[:`AFFILIATED_WITH`]->_558
create _170-[:`HAS_GENDER`]->_567
create _170-[:`VISITED` {`quantity`:1}]->_11
create _170-[:`VISITED` {`quantity`:3}]->_5
create _170-[:`VISITED` {`quantity`:7}]->_2
create _170-[:`VISITED` {`quantity`:2}]->_0
create _180-[:`HAS_GENDER`]->_567
create _180-[:`VISITED` {`quantity`:154}]->_2
create _180-[:`VISITED` {`quantity`:1}]->_0
create _190-[:`HAS_GENDER`]->_568
create _190-[:`VISITED` {`quantity`:1}]->_11
create _190-[:`VISITED` {`quantity`:1}]->_5
create _190-[:`VISITED` {`quantity`:3}]->_2
create _190-[:`VISITED` {`quantity`:1}]->_1
create _190-[:`VISITED` {`quantity`:1}]->_0
create _192-[:`AFFILIATED_WITH`]->_557
create _192-[:`HAS_GENDER`]->_567
create _192-[:`VISITED` {`quantity`:1}]->_11
create _192-[:`VISITED` {`quantity`:2}]->_5
create _192-[:`VISITED` {`quantity`:11}]->_1
create _210-[:`AFFILIATED_WITH`]->_553
create _210-[:`HAS_GENDER`]->_567
create _210-[:`VISITED` {`quantity`:1}]->_11
create _210-[:`VISITED` {`quantity`:3}]->_5
create _210-[:`VISITED` {`quantity`:2}]->_2
create _210-[:`VISITED` {`quantity`:9}]->_1
create _210-[:`VISITED` {`quantity`:3}]->_0
create _243-[:`AFFILIATED_WITH`]->_559
create _243-[:`HAS_GENDER`]->_568
create _243-[:`VISITED` {`quantity`:1}]->_5
create _243-[:`VISITED` {`quantity`:1}]->_2
create _243-[:`VISITED` {`quantity`:4}]->_1
create _245-[:`HAS_GENDER`]->_568
create _245-[:`VISITED` {`quantity`:1}]->_5
create _245-[:`VISITED` {`quantity`:1}]->_2
create _245-[:`VISITED` {`quantity`:10}]->_1
create _245-[:`VISITED` {`quantity`:1}]->_0
create _252-[:`HAS_GENDER`]->_567
create _252-[:`VISITED` {`quantity`:1}]->_11
create _252-[:`VISITED` {`quantity`:2}]->_5
create _252-[:`VISITED` {`quantity`:1}]->_2
create _252-[:`VISITED` {`quantity`:3}]->_1
create _252-[:`VISITED` {`quantity`:1}]->_0
create _279-[:`HAS_GENDER`]->_568
create _279-[:`VISITED` {`quantity`:2}]->_2
create _279-[:`VISITED` {`quantity`:2}]->_1
create _279-[:`VISITED` {`quantity`:2}]->_0
create _291-[:`AFFILIATED_WITH`]->_554
create _291-[:`HAS_GENDER`]->_567
create _291-[:`VISITED` {`quantity`:5}]->_5
create _291-[:`VISITED` {`quantity`:18}]->_2
create _291-[:`VISITED` {`quantity`:24}]->_1
create _291-[:`VISITED` {`quantity`:6}]->_0
create _302-[:`AFFILIATED_WITH`]->_559
create _302-[:`HAS_GENDER`]->_568
create _302-[:`VISITED` {`quantity`:1}]->_11
create _302-[:`VISITED` {`quantity`:3}]->_5
create _302-[:`VISITED` {`quantity`:8}]->_2
create _302-[:`VISITED` {`quantity`:11}]->_1
create _330-[:`HAS_GENDER`]->_567
create _330-[:`VISITED` {`quantity`:1}]->_11
create _330-[:`VISITED` {`quantity`:1}]->_2
create _330-[:`VISITED` {`quantity`:1}]->_1
create _330-[:`VISITED` {`quantity`:1}]->_0
create _380-[:`AFFILIATED_WITH`]->_557
create _380-[:`HAS_GENDER`]->_568
create _380-[:`VISITED` {`quantity`:1}]->_11
create _380-[:`VISITED` {`quantity`:1}]->_2
create _380-[:`VISITED` {`quantity`:3}]->_1
create _380-[:`VISITED` {`quantity`:2}]->_0
create _423-[:`HAS_GENDER`]->_567
create _423-[:`VISITED` {`quantity`:1}]->_11
create _423-[:`VISITED` {`quantity`:2}]->_5
create _423-[:`VISITED` {`quantity`:29}]->_1
create _423-[:`VISITED` {`quantity`:1}]->_0
create _429-[:`HAS_GENDER`]->_567
create _429-[:`VISITED` {`quantity`:2}]->_11
create _429-[:`VISITED` {`quantity`:1}]->_5
create _429-[:`VISITED` {`quantity`:21}]->_1
create _445-[:`HAS_GENDER`]->_567
create _445-[:`VISITED` {`quantity`:5}]->_2
create _445-[:`VISITED` {`quantity`:4}]->_1
create _445-[:`VISITED` {`quantity`:1}]->_0
create _448-[:`HAS_GENDER`]->_567
create _448-[:`VISITED` {`quantity`:2}]->_2
create _448-[:`VISITED` {`quantity`:2}]->_1
create _448-[:`VISITED` {`quantity`:4}]->_0
create _509-[:`HAS_GENDER`]->_567
create _509-[:`VISITED` {`quantity`:1}]->_5
create _509-[:`VISITED` {`quantity`:1}]->_2
create _509-[:`VISITED` {`quantity`:1}]->_1
create _509-[:`VISITED` {`quantity`:1}]->_0


